Get Our Monthly Report For Free!
Trust Track Records, not Hype
We analyzed +5,000 recommendations from +30k videos to separate signal from noise.
Get the latest report now!
The "Wall of Truth"
Numbers don't lie. People do.
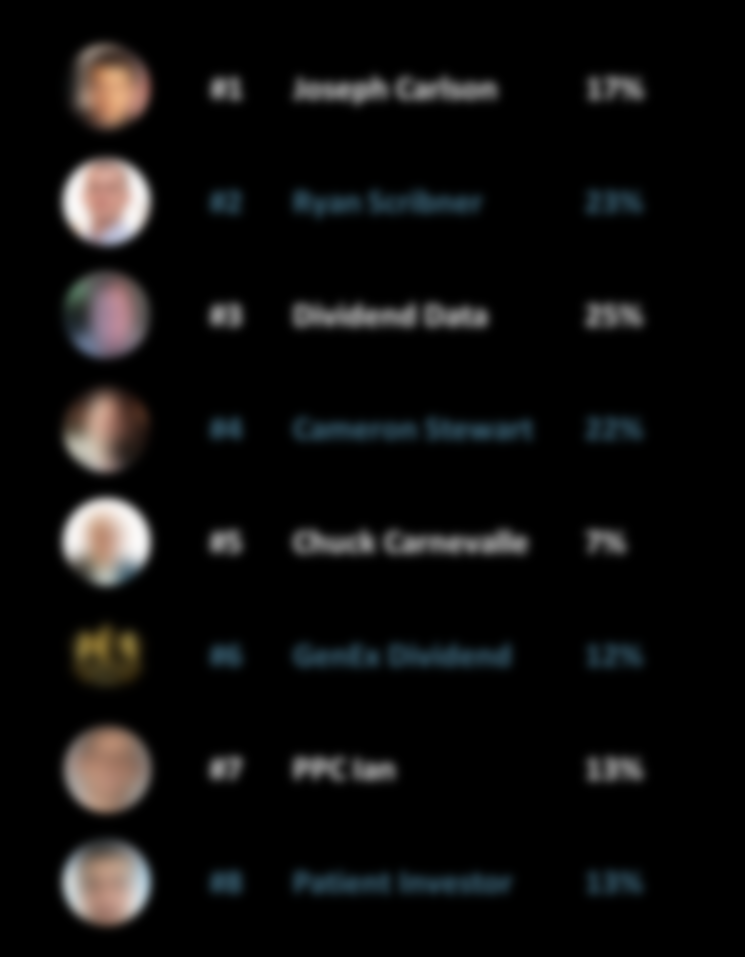
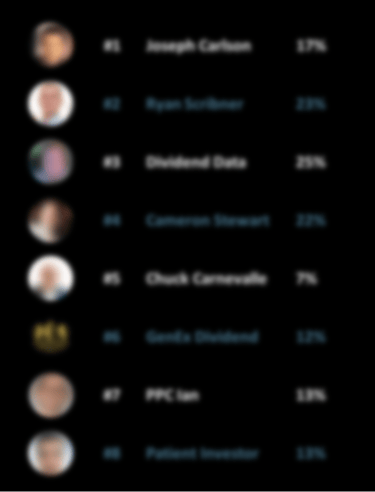
Influencer
Rank
CAGR 1Y
Unlock Full Leaderboard
Get access to the ranking and detailed analytics in our monthly report!
How Do We Rank Them?
We monitor the feed of the most influencial finance Youtubers, and we record every buy recommendation.
Finally, we update our monthly ranking based on the 1 year CAGR performance of the Youtubers analyzed until the current month.
We then track the performance of the recommendation over the following years.